IR Information top page
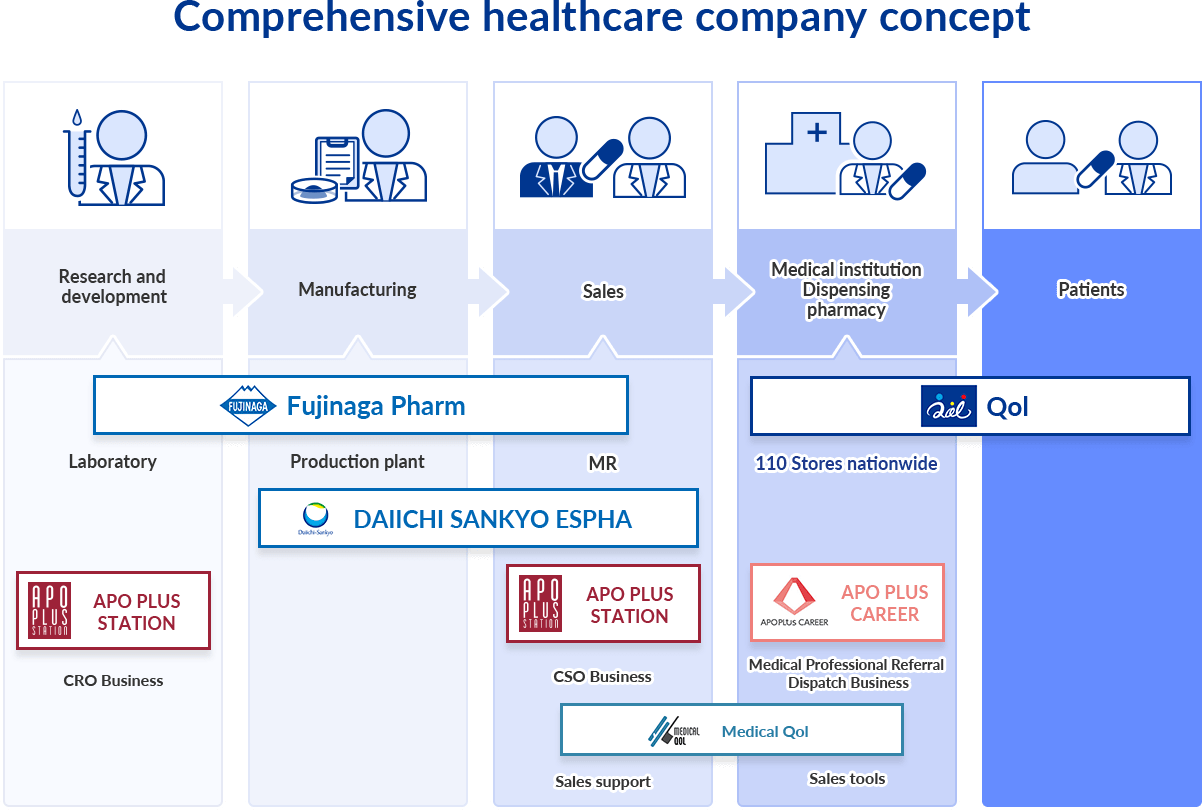
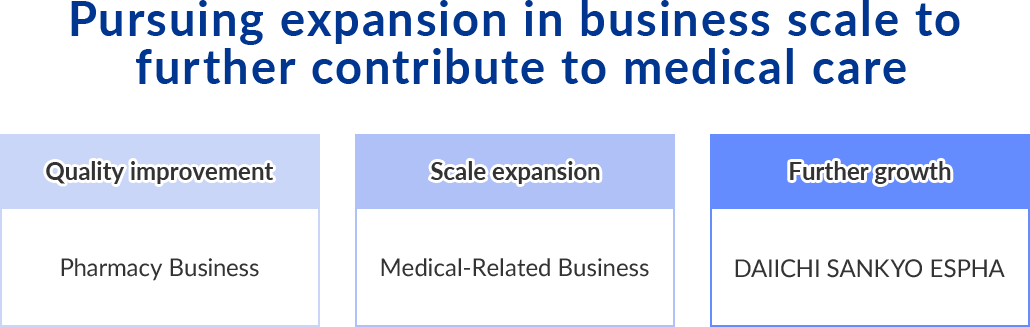
Further growth in the field of "medicine and healthcare"
Aiming to become a comprehensive healthcare company providing seamless medical care services
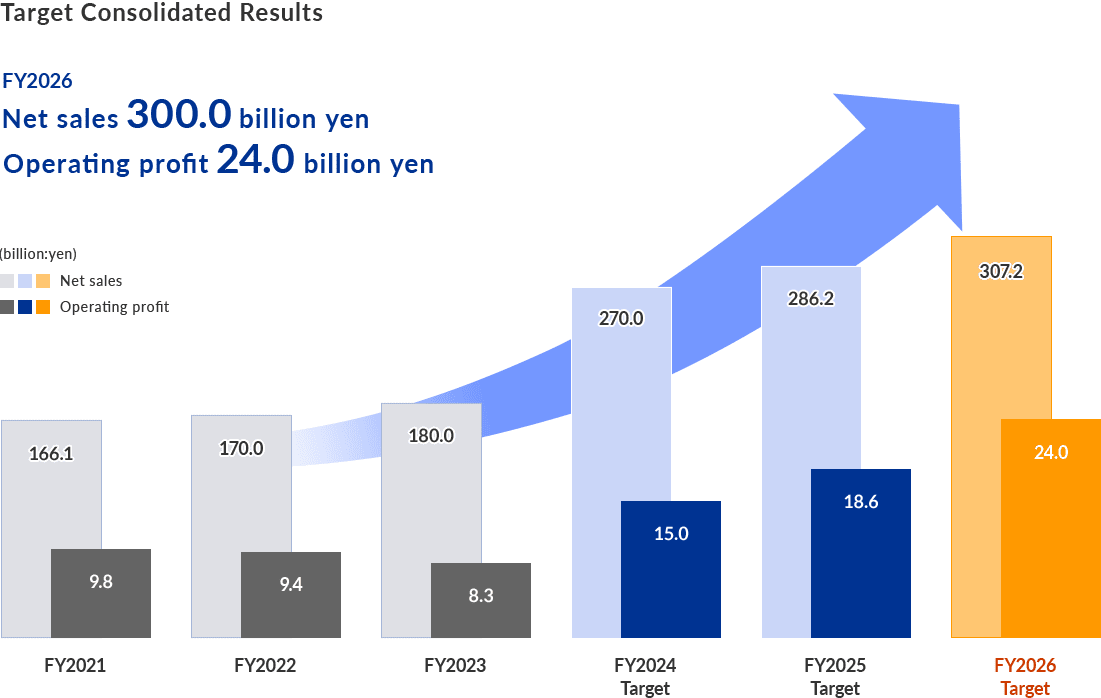
The Qol Group aims to achieve further growth by strengthening new businesses and maximizing group synergy, as a comprehensive healthcare company that seamlessly provides a full lineup of services to patients in the healthcare field, spanning research and development, manufacturing, sales and dispensing.
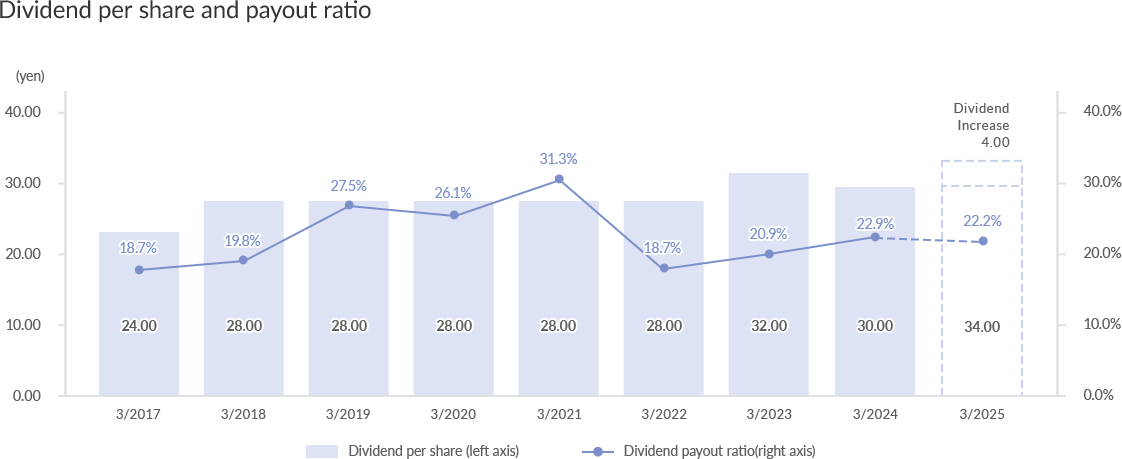
Shareholder Returns
Stable return of profits and enhancement of shareholder benefit program
The Qol Group's basic policy is to pay stable and continuous dividends to shareholders while giving due consideration to ensuring growth funds for future business development and reinforcement of its management base.
We are also enhancing our shareholder benefit program with the aim of increasing the number of long-term shareholders.